
Ryder Glacier drains from the northern margin of the Greenland Ice Sheet into Sherard Osborn Fjord. The glacier was first surveyed by Lauge Koch in 1917. By 1956 the glacier had lost 75% of its floating tongue. Since 1990 the glacier front has advanced slightly with much of this change beginning in a mini-surge in 1995. As noted in the Arctic Report Card 2010 since 2000, the net area change of the 35 widest marine-terminating glaciers is -1535 km2. This is an effective average glacier length change of -1.7 km since year 2000. While the overall area change indicates the largest observed retreat, 7 of 35 glaciers did advance in 2010 relative to 2009. The largest glacier advances were at Ryder and Storstrømmen glacier, each advancing 4.6 and 4.2 km2, respectively.The shelf front of Ryder Gletscher advanced has advanced recently at about the
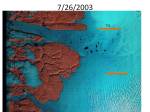
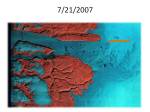
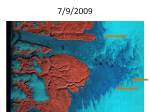
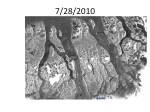
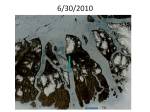
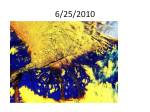
rate of flow, but it is thin <200 m and fractured in the floating region. This does not appear to be an advance driven by increased mass balance. In the last decade particularly since 2003 the transient snowline observable in satellite images has in most years reached 1000 m. The floating tongue has to date managed to avoid the large losses on Petermann Glacier. Both glaciers have experienced enhanced surface melt, the key has been greater basal melt to date at Petermann Glacier. This is in contrast to the 800 m level reported in the Satellite image Atlas of Greenland. The transient snowline (TSL) on the outlet glaciers of the local ice caps provides a crucial measure of annual balance and the extent of significant melting on the Ice Sheet. The number of satellite images available has increased dramatically providing the capability for TSL identification daily if clouds permit using MODIS. MODIS, Landsat 7, NOAA Microwave imagery and ENVISAT images below indicate the transient snowline for the Ryder Glacier area. Note that many of images from late June indicate a TSL in the 1000 m range even early in the melt season. To the west of Ryder Glacier (R), Steensby Glacier (S) and sometime Petermann Glacier (P) are evident n the outlet glaciers of Steensby Gletscher and Ryder Gletscher, where
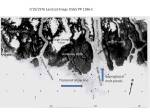
it reaches an altitude of approximately 800 m. Ryder Glacier’s TSL lies very close to the southern boundary of the processed images from the Danish Meteorological Institute. The first slide is the topgraphy of the Ryder Glacier near the TSL, the second is a 1976 satellite image from the USGS Greenland Satellite Image Atlas 1386-c. The rest are annotated images downloaded from DMI or from the USGS for the Landsat images which are false color images. The TSL tends to rise from 975 m to the east of the glacier outlet to 1100 m south of and west of the fjord entrance.


Pingback: Eco Logs – Kindling Wood – Kindling For Sale – Kindling » Blog Archive » Greenland Ice Sheet outlet glaciers ice loss: an overview