

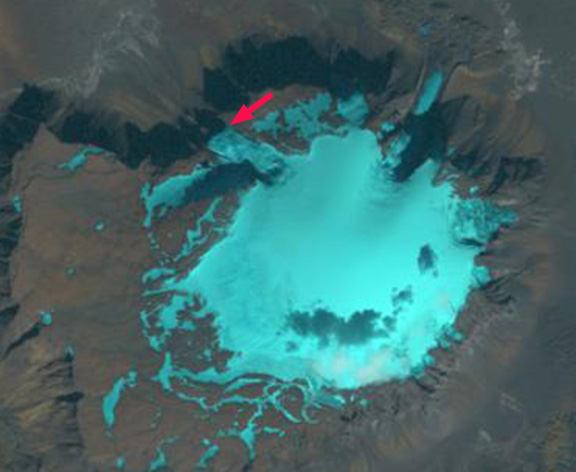
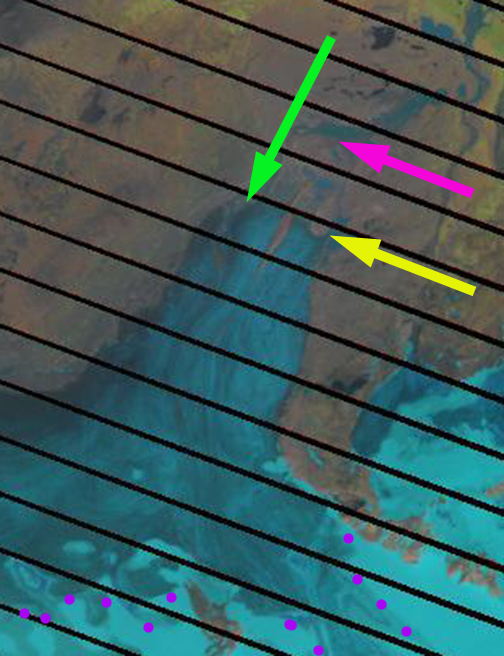
Tungnafellsjökull Ice Cap in 1999 and 2020 Landsat images indicating terminus changes at three northern outlets, red arrows, and at four locations of bedrock exposure.
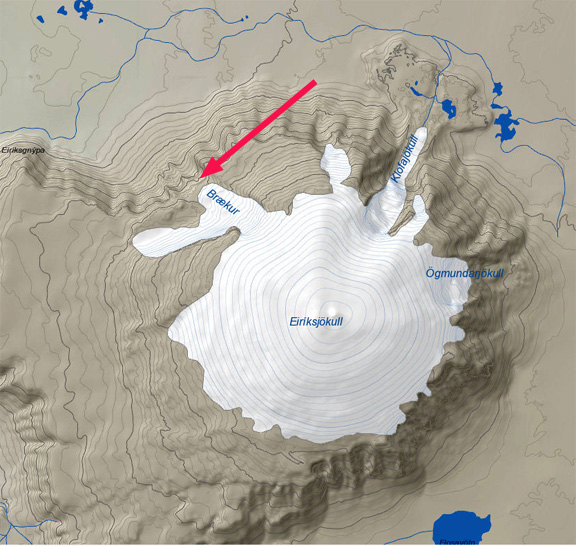
Tungnafellsjökull Ice Cap is a ~32km2 ice cap located between Vatnajökull and Hofsjökull. Gunnlaugsson (2016) reported on the mass balance changes of the Tungnafellsjökull Ice Cap and found it had lost 20 of its volume and 16% of its area from 1960-2013. The ice cap was essentially in balance from 1960-1986 and had a slight mass balance loss from 1986-1995. Almost all of the loss has been since 1995. Belart et al (2020) report on losses from 14 smaller glacier in Iceland including Tungnafellsjökull and found signficant increase in mass loss from a near equilibrium 0.07 m/year from 1960-1994 to -1.20 m/year from 1995-2010. Here we examine the impact of the 25 years of sustained mass loss on Tungnafellsjökull using Landsat images.
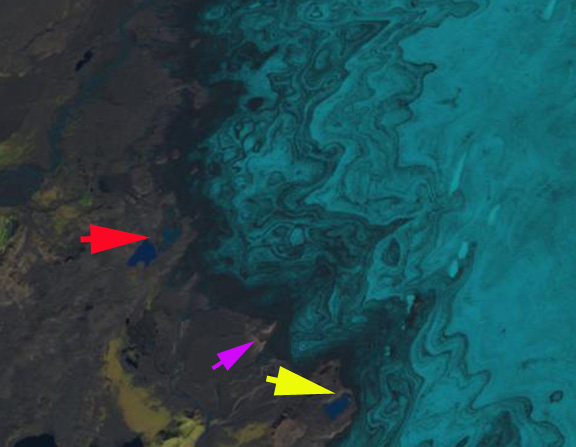
In 1999 the transient snow line in August is at ~1200 m. Point A,B and D indicate bedrock knobs amidst the ice cap and Point C a bedrock ridge that the ice cap flows over near Point C. The three northern outlets terminate at the red arrows. From east to west they are Nordur Tungnafellsjökull, Innri Hagajökull and Fremri Hagajökull. In 2000 the transient snowline in August is again at ~1200 m. In 2014 the snowline was above 1500 m laving the ice cap without any retained snowpack from the previous winter. The area of exposed firn encompasses 40% of the ice cap indicating the size of the accumulation zone in the several years prior to 2014. By 2016 the ice cap no longer flows over the ridge near Point C. The transient snowline is at ~1400 m. In 2020 the transient snowline is at ~1350 m. The bedrock knob at Point B is no longer surrounded by the ice cap. The bedrock at Point A and D have expanded. The retreat from 1999-2020 is most significant at the three northern outlet glaciers, where Gunnlaugsson (2016) indicated thinning was greatest. The retreat has been 200 m at Nordur Tungnafellsjökull, 600 m at Innri Hagajökull and 500 m at Fremri Hagajökull.
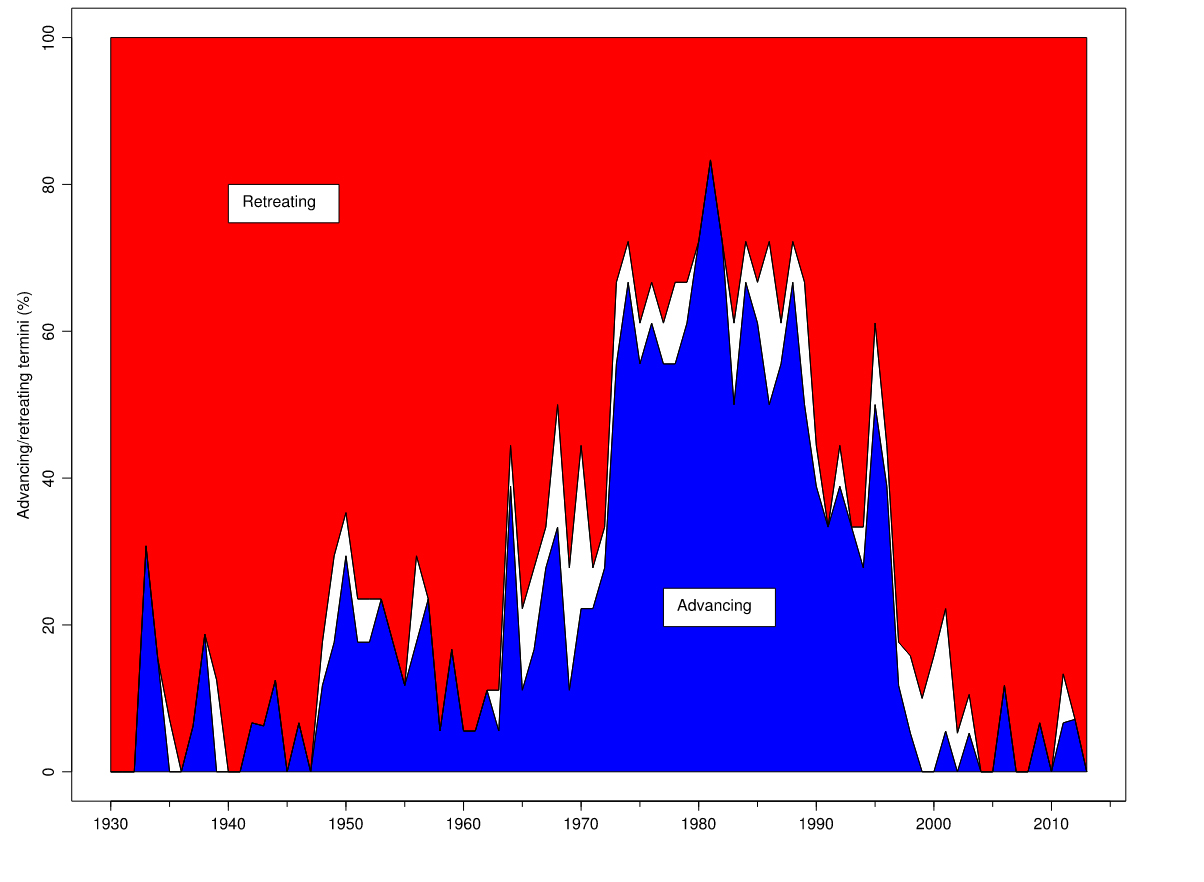
With an accumulation area covering approximately 40% of the ice cap, mass balance losses will continue and the ice cap will continue to retreat. Retreat has been the consistent response of more than 90% of Iceland glaciers since 2000 (Iceland Glaciological Society), such as at Norðurjökull.

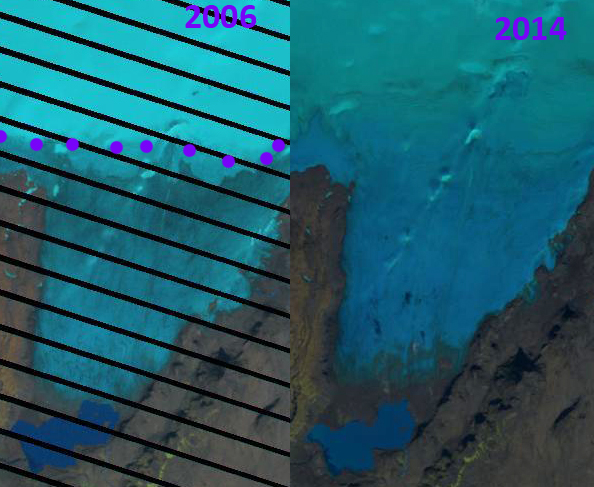
Tungnafellsjökull Ice Cap in 2000 and 2016 Landsat images indicating terminus changes at three northern outlets, red arrows, and at four locations of bedrock exposure.

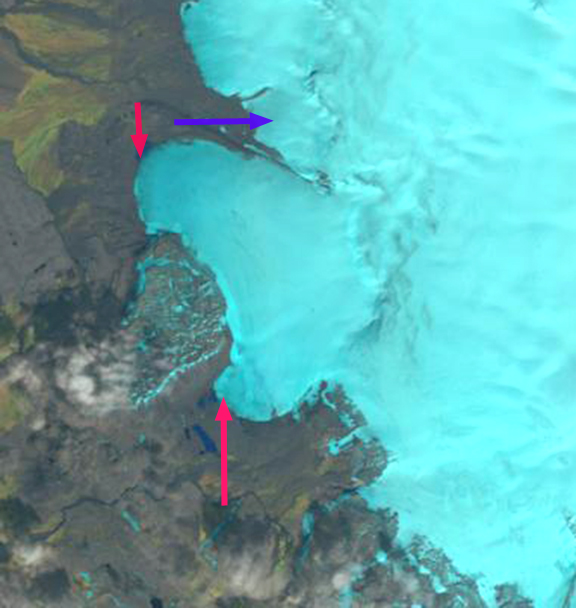
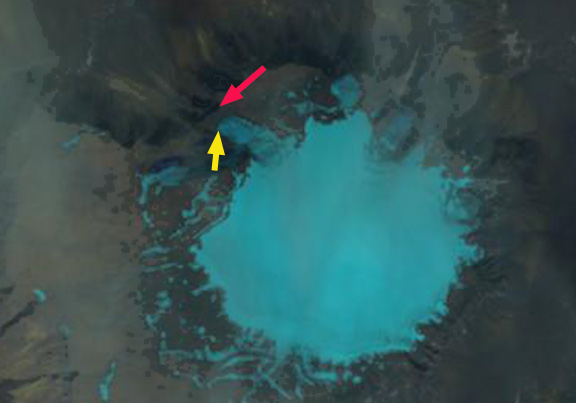
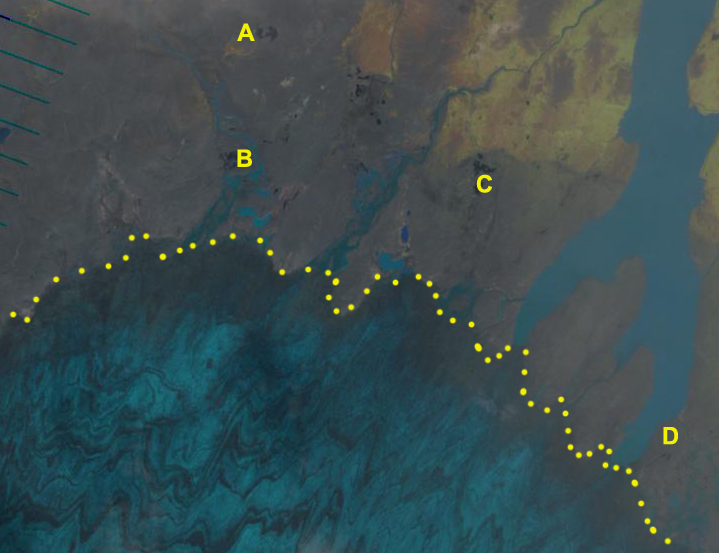
Landsat image in August 2014 indicating the lack of retained snowcover. The glacier surface is bare ice blue-gray and exposed firn indicated by the zone inside of the yellow dots.


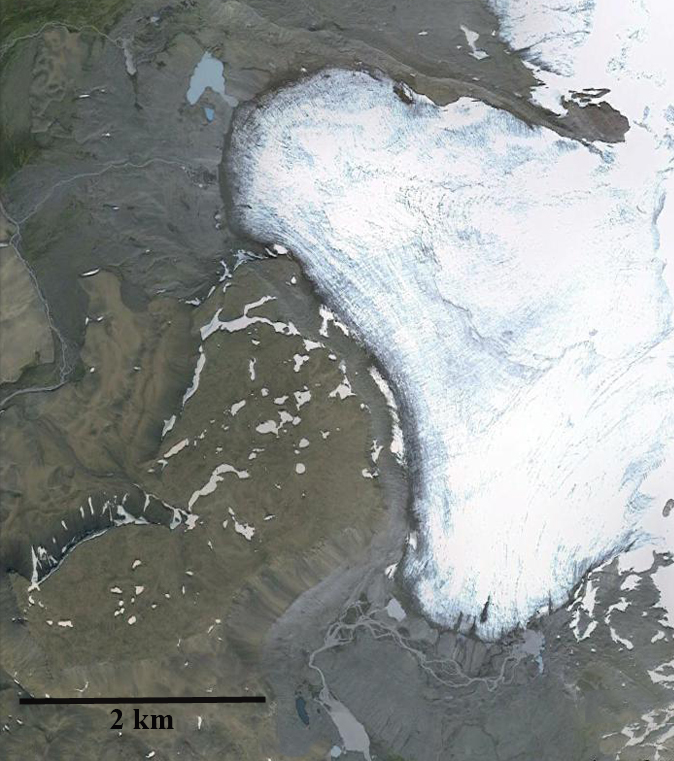


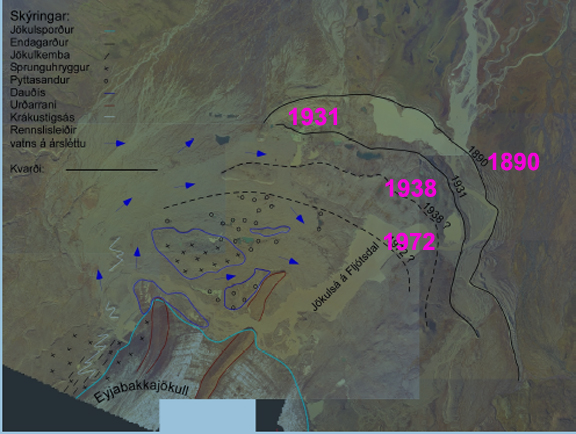
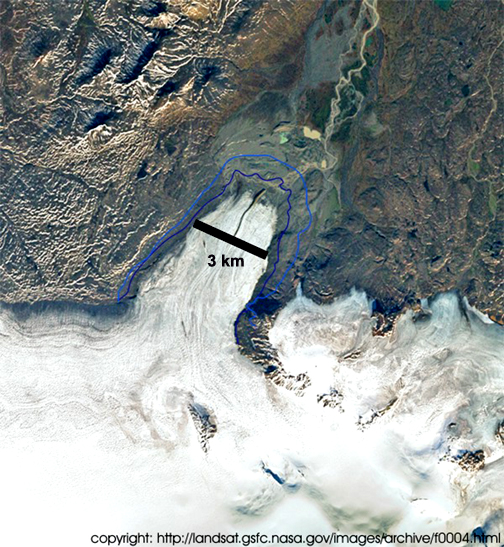

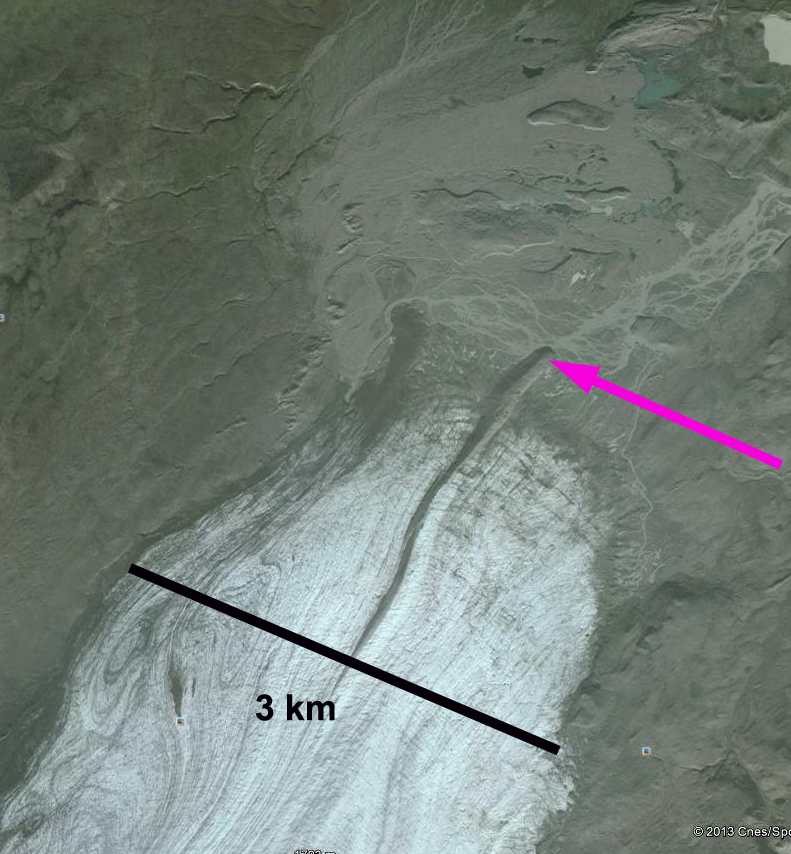


 The mass balance of this glacier has also been measured since 2000. During that period the glacier has had a negative balance every year, 8 of the nine years the mass balance exceeding 1 meter of water equivalent loss. The total loss for the period of 12 m, will lead to continued retreat. This is a substantial thinning of the glacier, but a small part of the total volume given a glacier that averages more than 500 m in thickness. The equilibrium line has been high since 2000, leading to only 40% of the glacier being snow covered at the end of the summer. on a glacier like this that lacks avalanche accumulation due to its low and consistent slope at least 60% of the glacier must be snow covered to have an equilibrium balance this would be 1150 m. This height is close to the elevation midpoint of the glacier. Beyond the terminus the retreat is exposing a large relatively flat plain that is rich with glacial geologic deposits, many linear examples are evident. These features are streamline features from glacier flow. The retreat here is similar to the


